Improving visibility into what’s happening on your shop floor is important because it can make OT personnel more effective. However, most OT personnel lack the tools to connect to industrial data sources and transform operational data into meaningful insights without relying on IT and expensive data warehouse infrastructures.
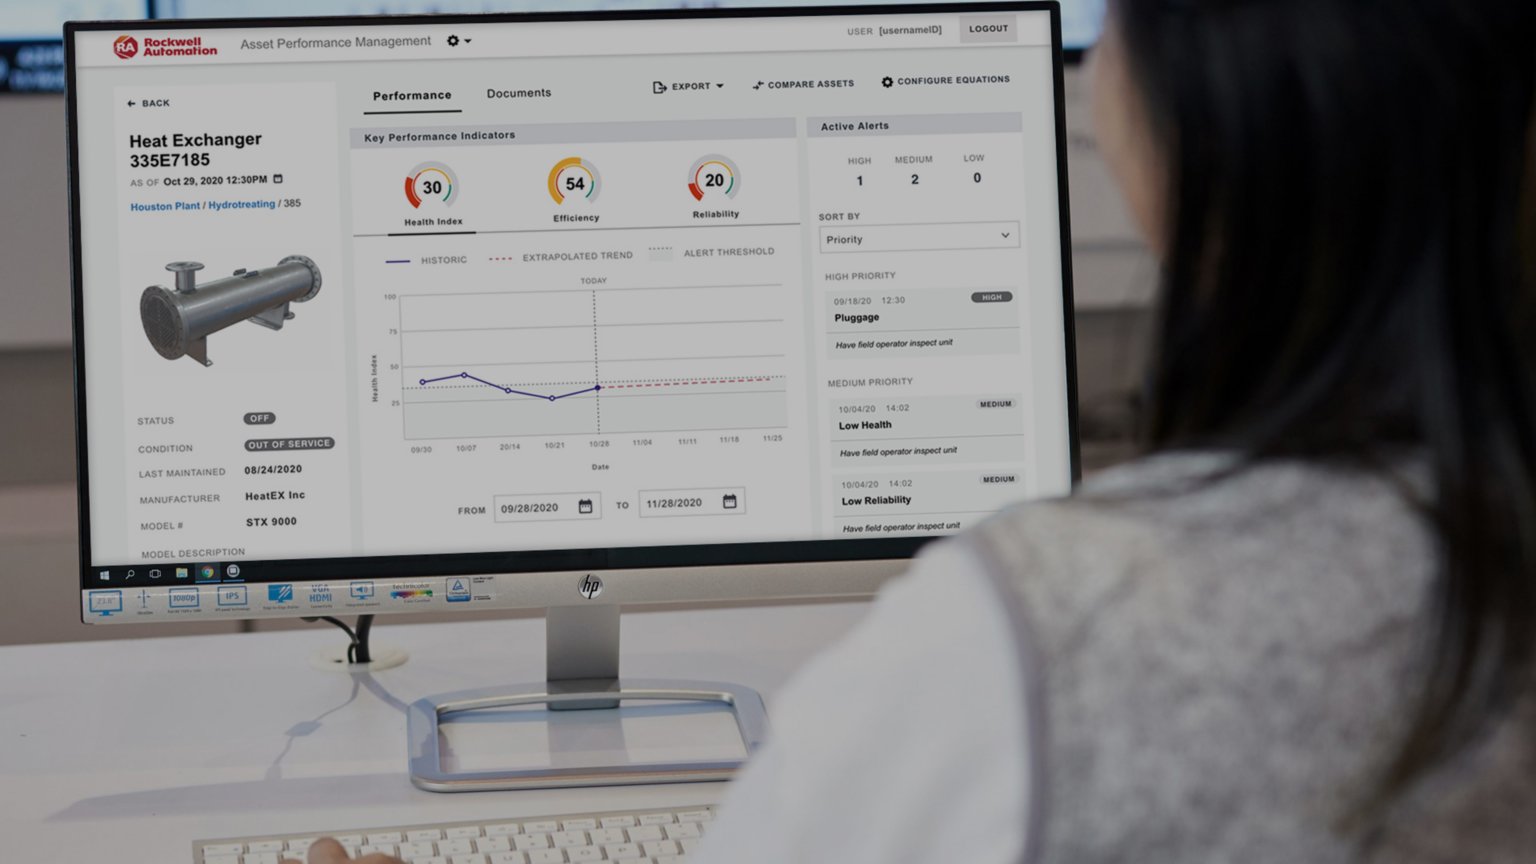
FactoryTalk® Analytics™ DataView helps increase visibility, improve productivity and enhance efficiency by getting you insights on your line, shop floor, plant and enterprise faster. It gives OT professional the power to pull data of interest from virtually any point—programmable or distributed control systems, historians, MES, enterprise applications—in their operations. DataView can add context, mash up data sets, and quickly transform them into actionable information via storyboards. With a user-friendly, browser-based interface, analyzing data is quick and intuitive.

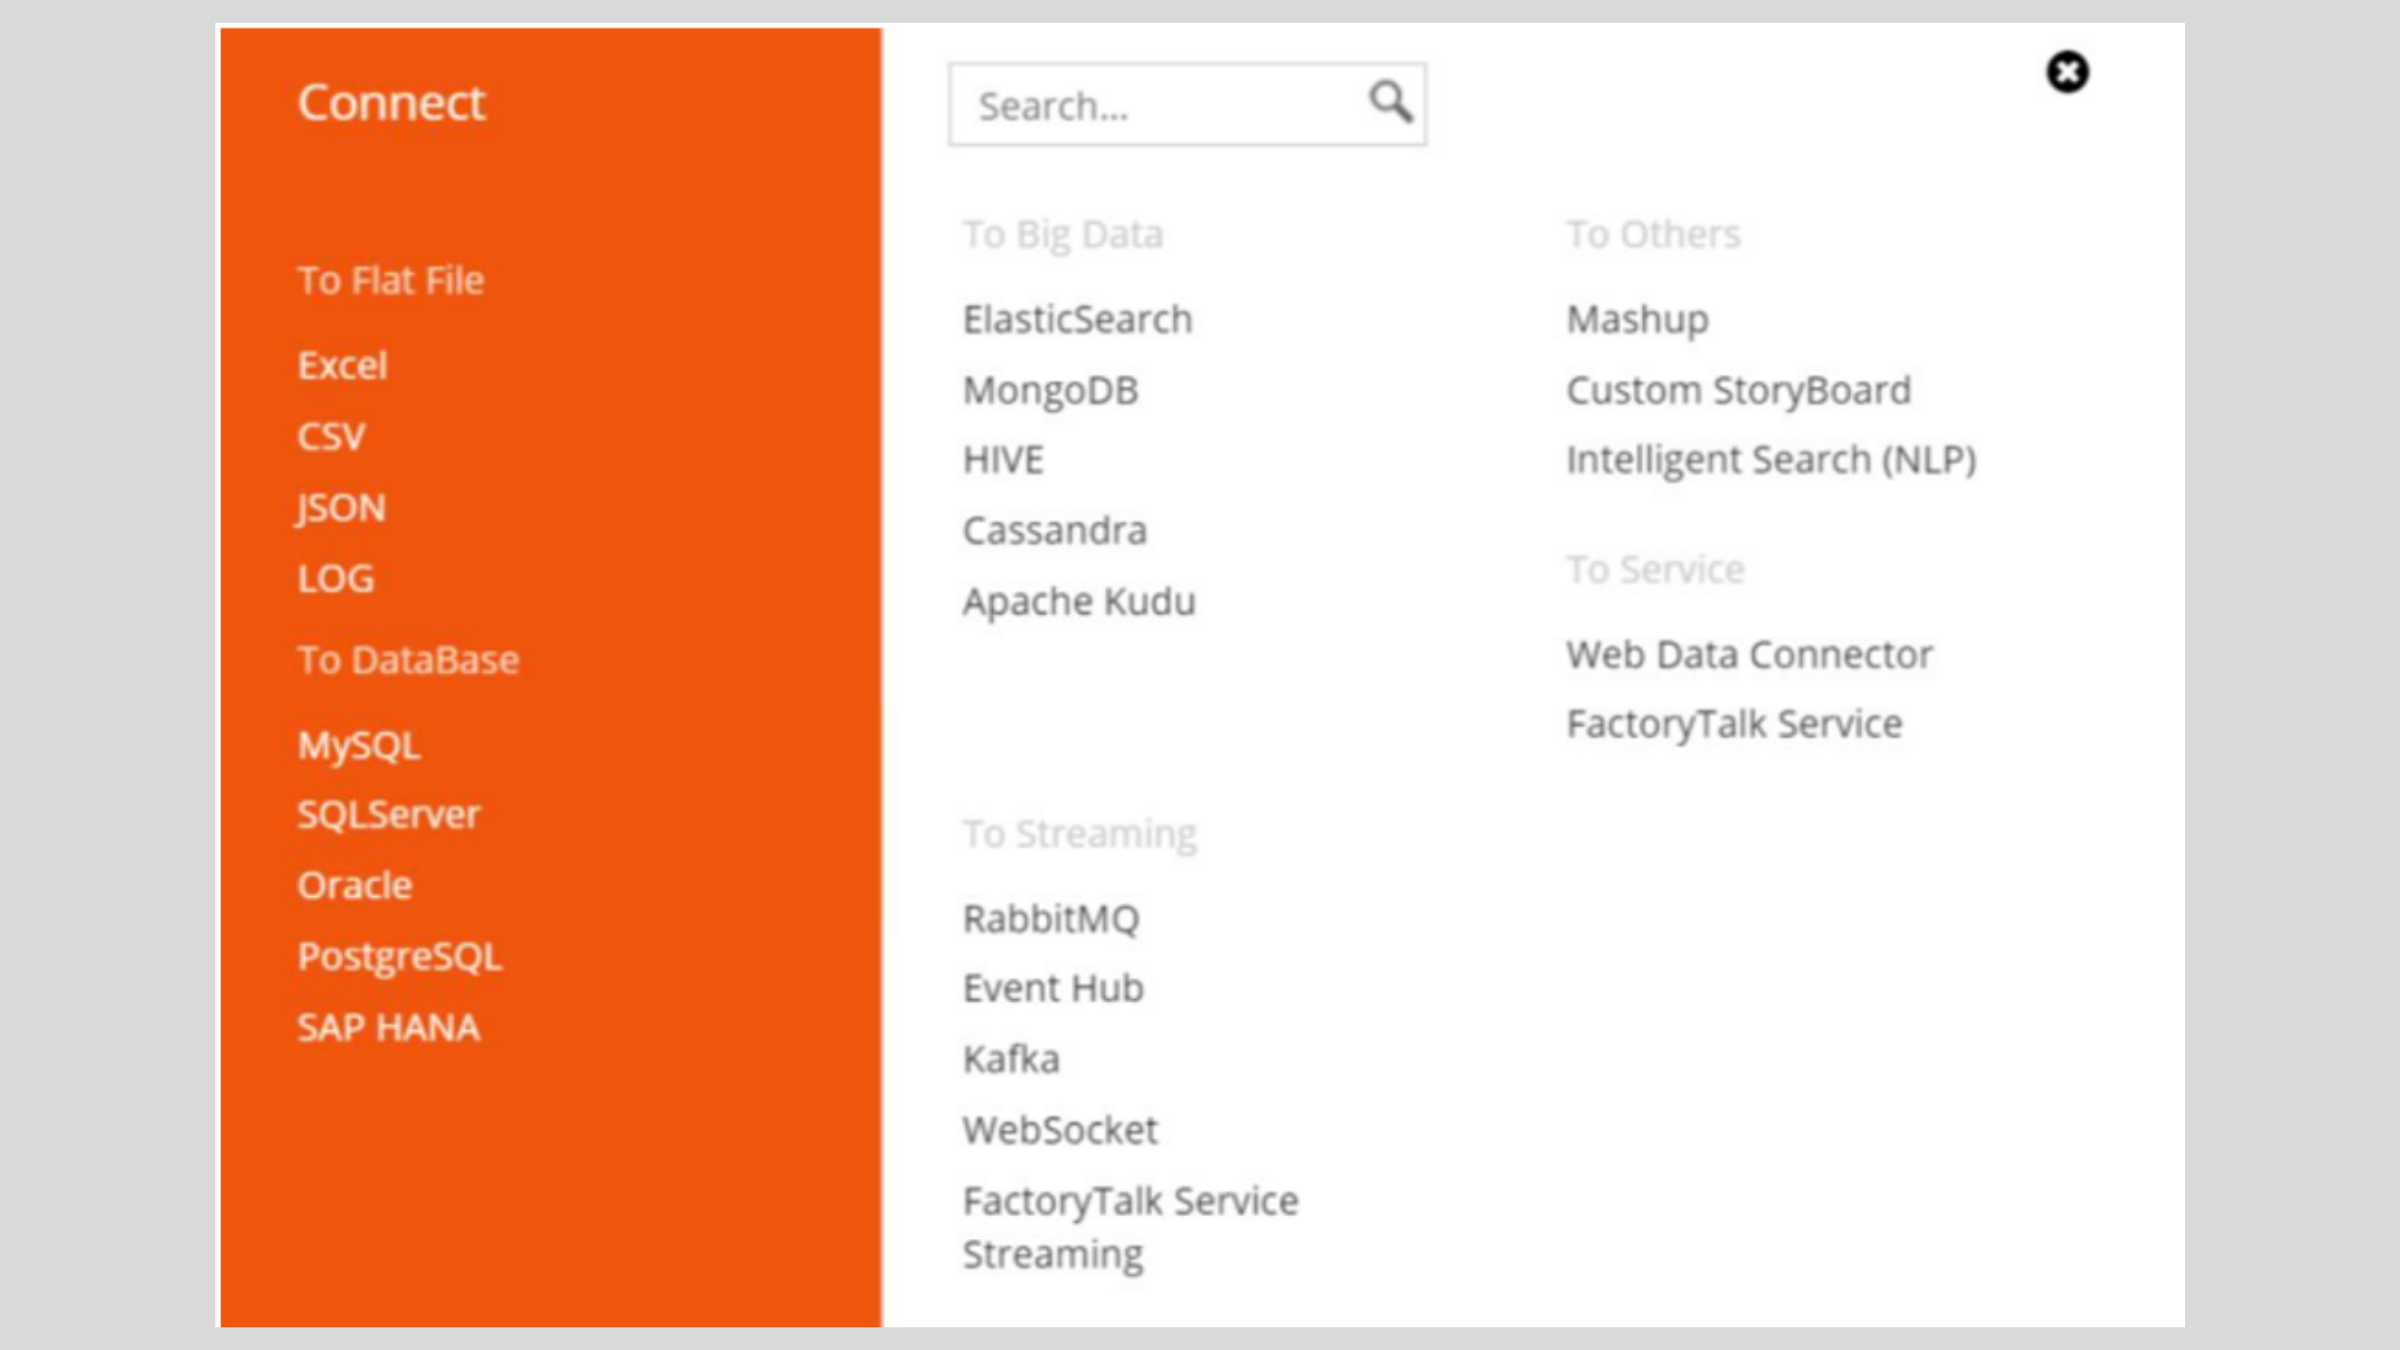
Aggregate Industrial Data for Generating Intuitive Insights
Through a robust choice of easy-to-establish and secure connections, your data sources—be it alarm databases, live data, past data from specific historians or datasets from different locations—can all quickly be aggregated for fresh insights into operations, including enterprise-wide views. This empowers OT professionals to fuse disparate data together and generate intuitive insights that would be hidden otherwise.
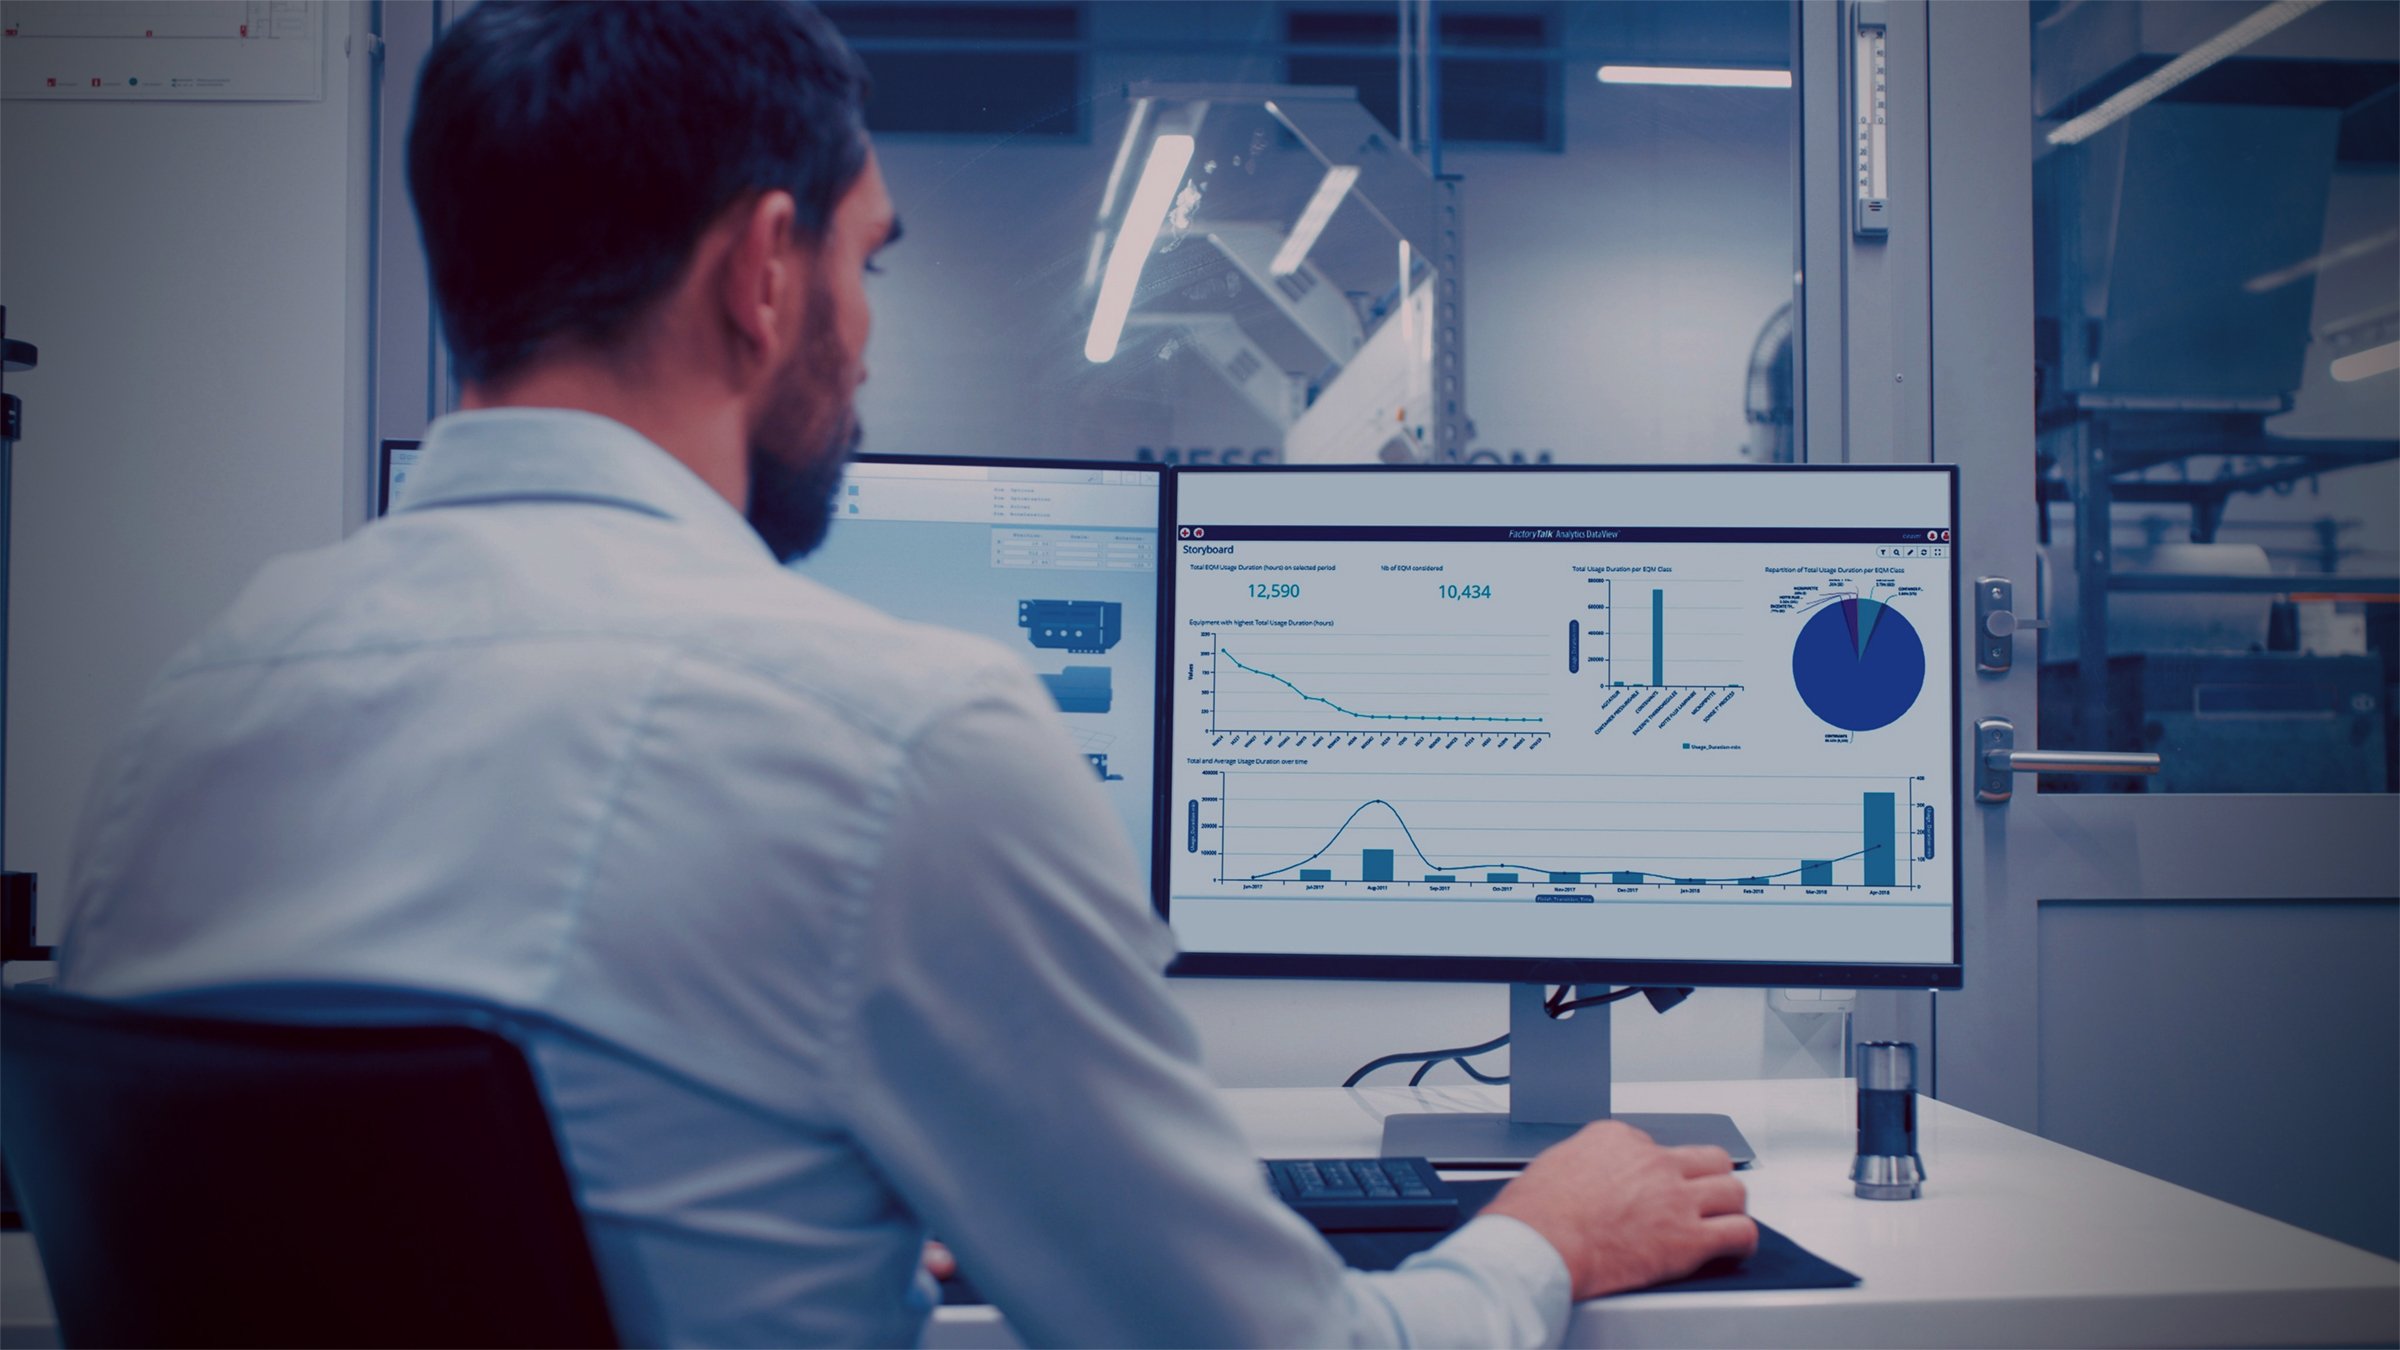
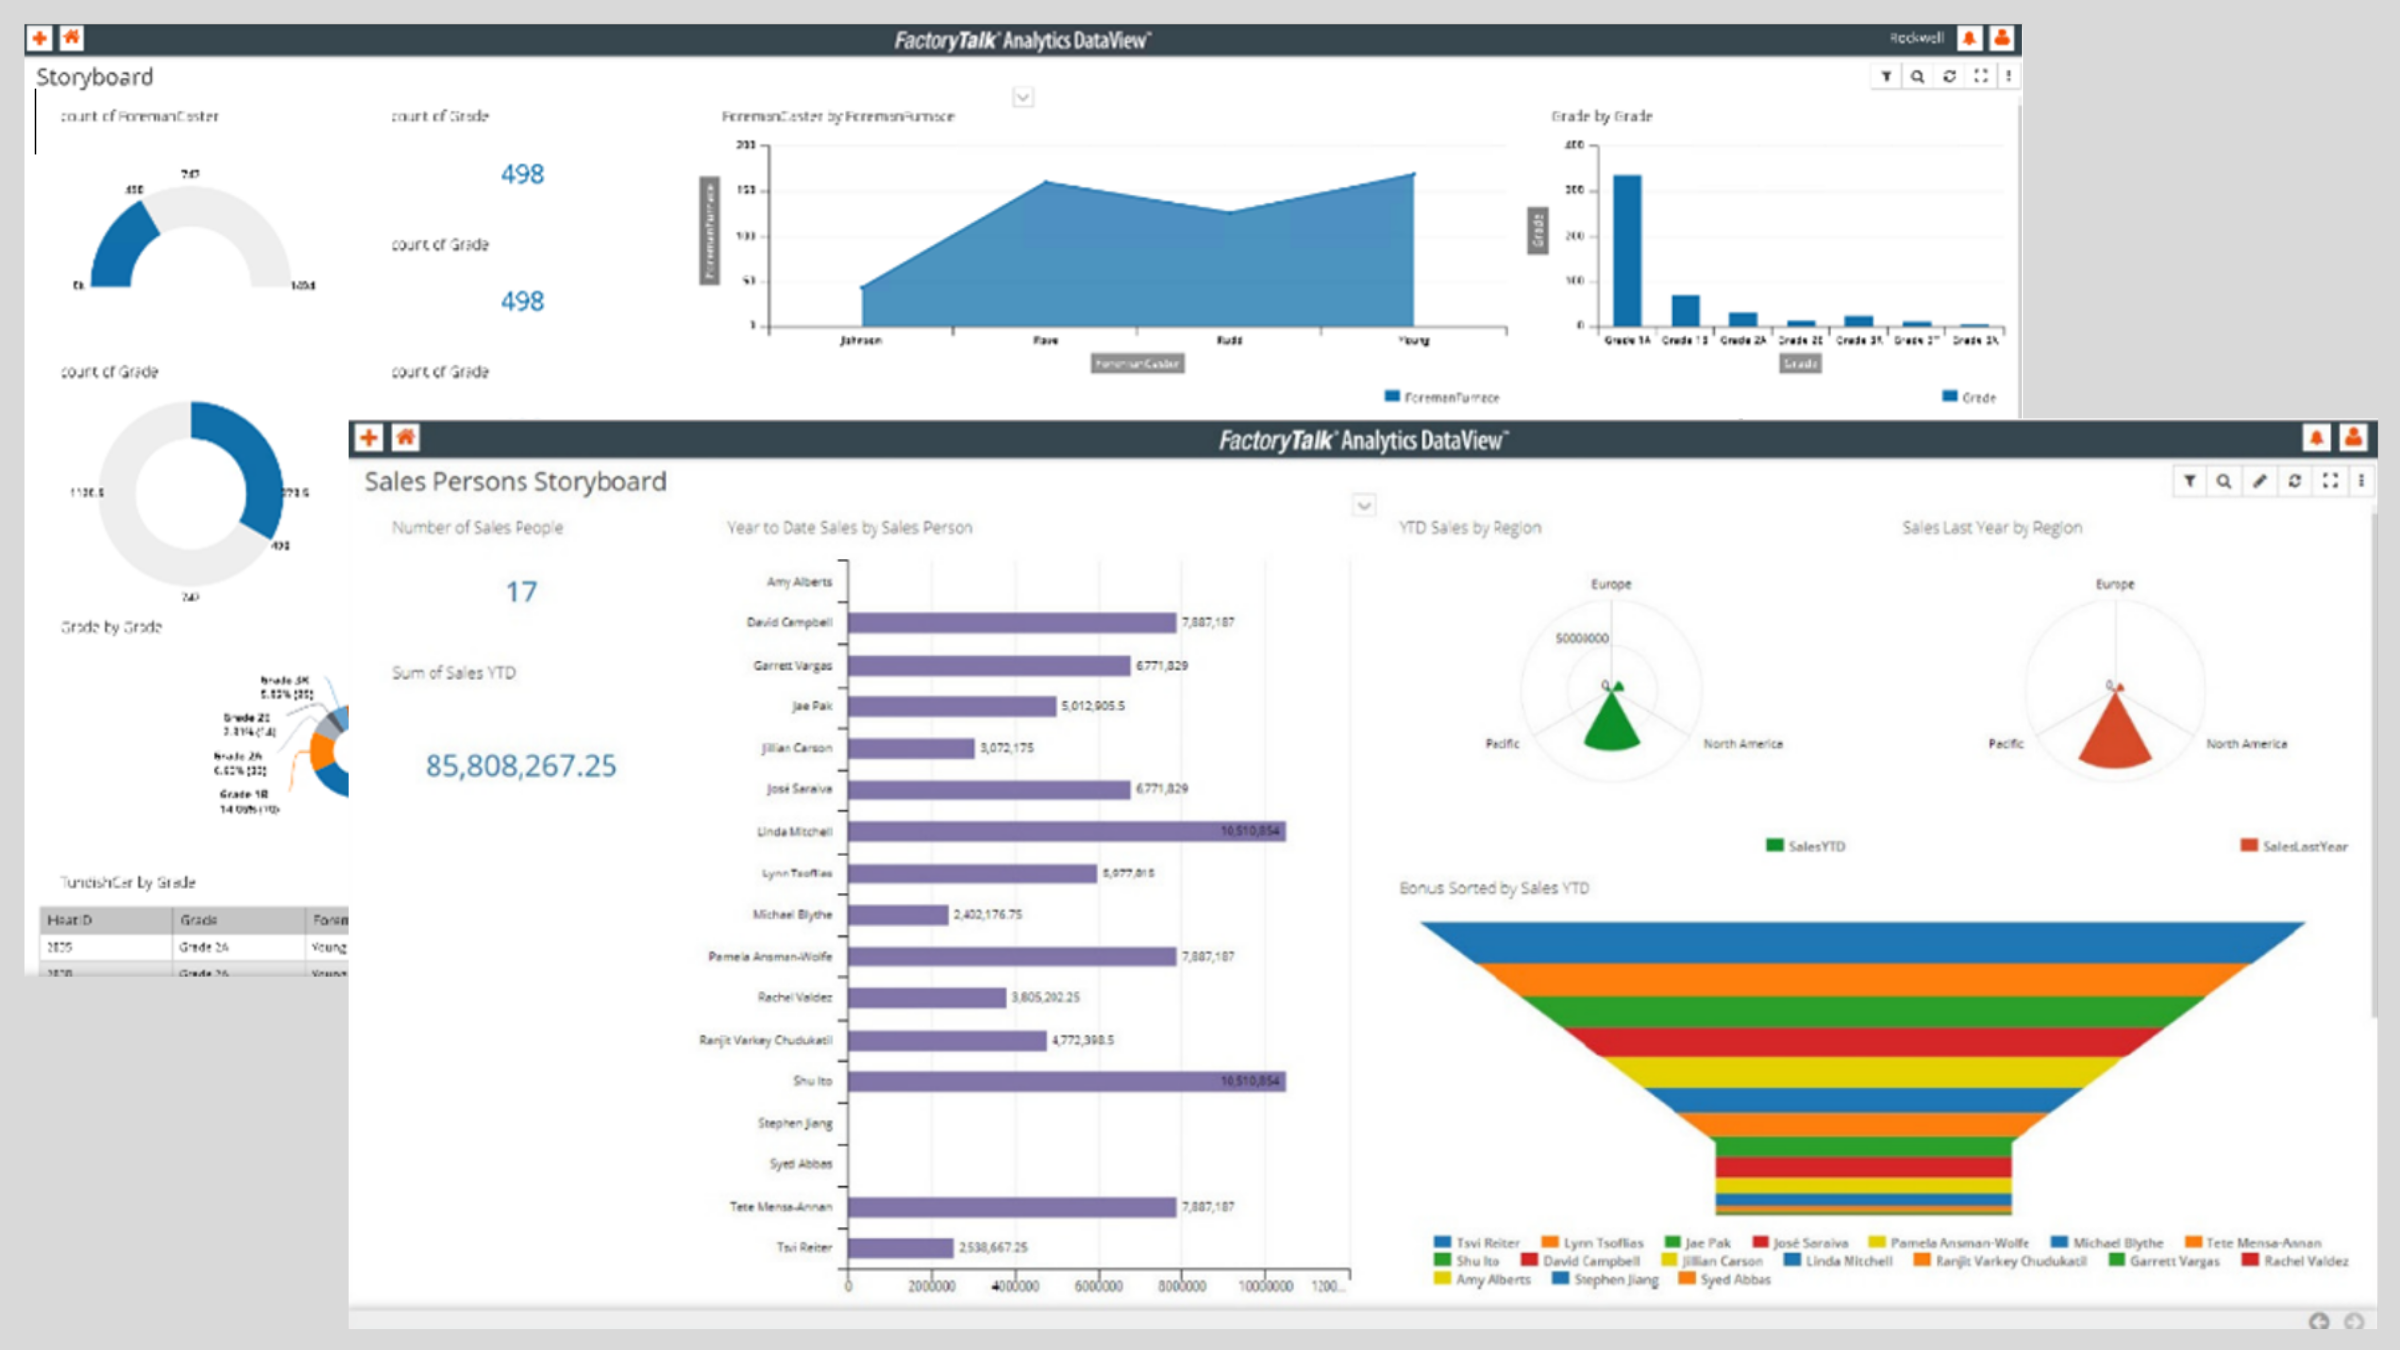
Quickly Spin Up Interactive Storyboards for Collaboration
Create interactive and customizable storyboards to add context, drilldown as needed, perform root cause analysis, and even combine storyboards into a single view that can be shared with others—all from an easy-to-use, browser-based interface that business users can use on desktops, smartphones or tablets.
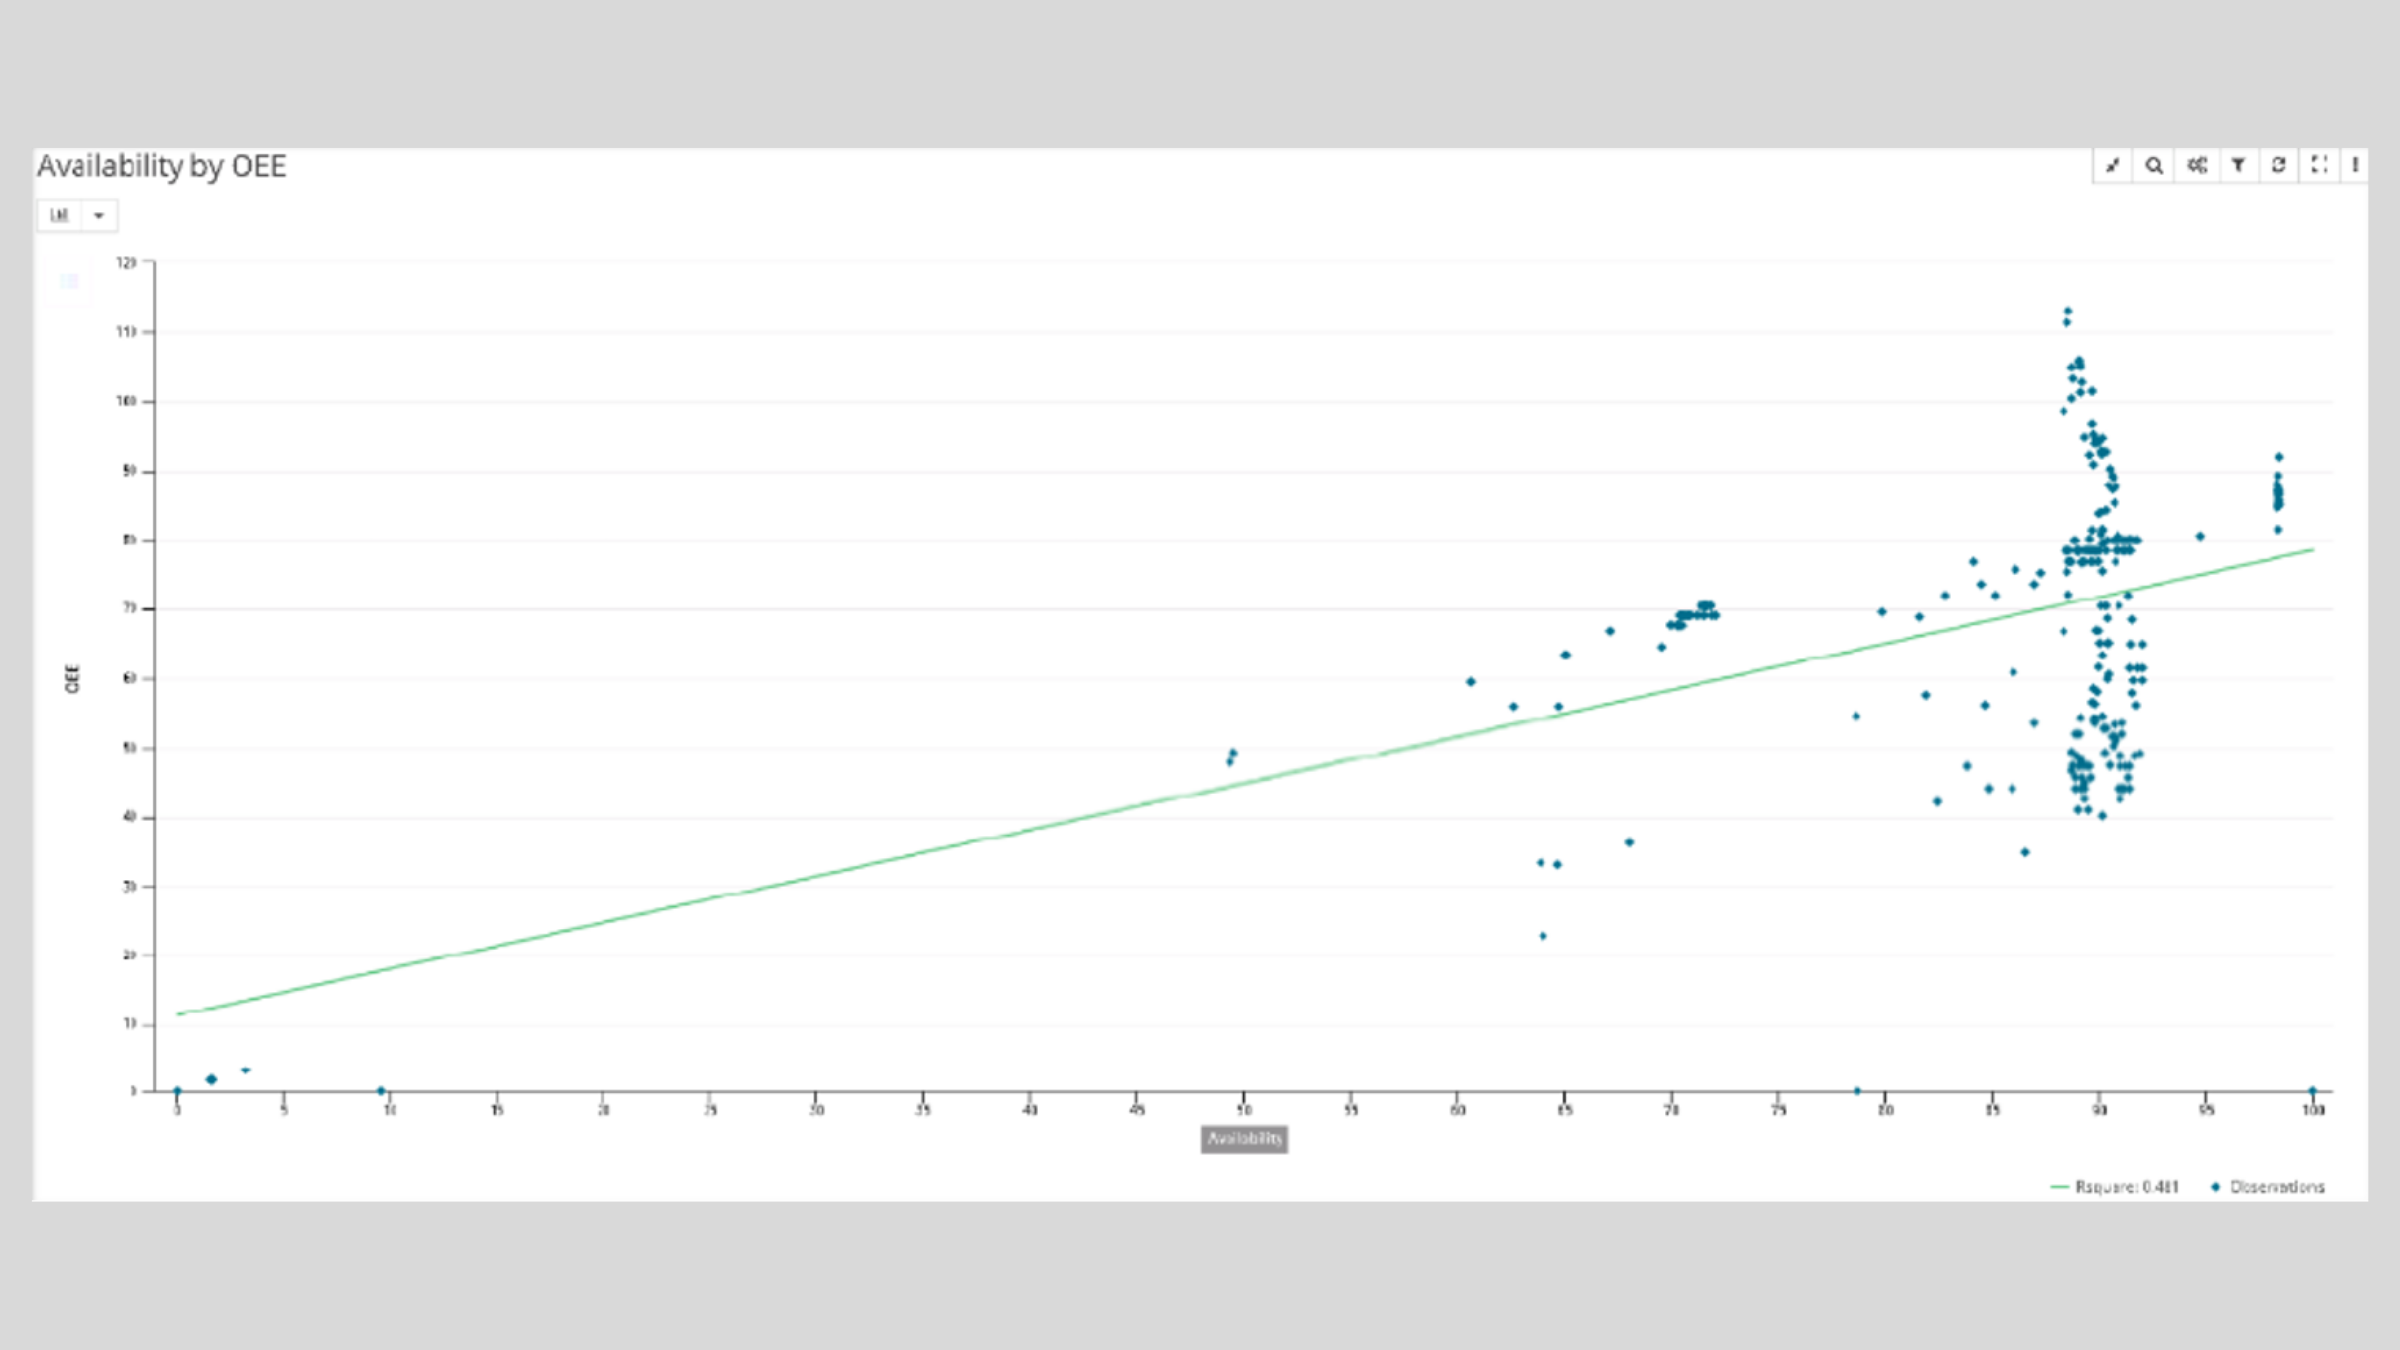
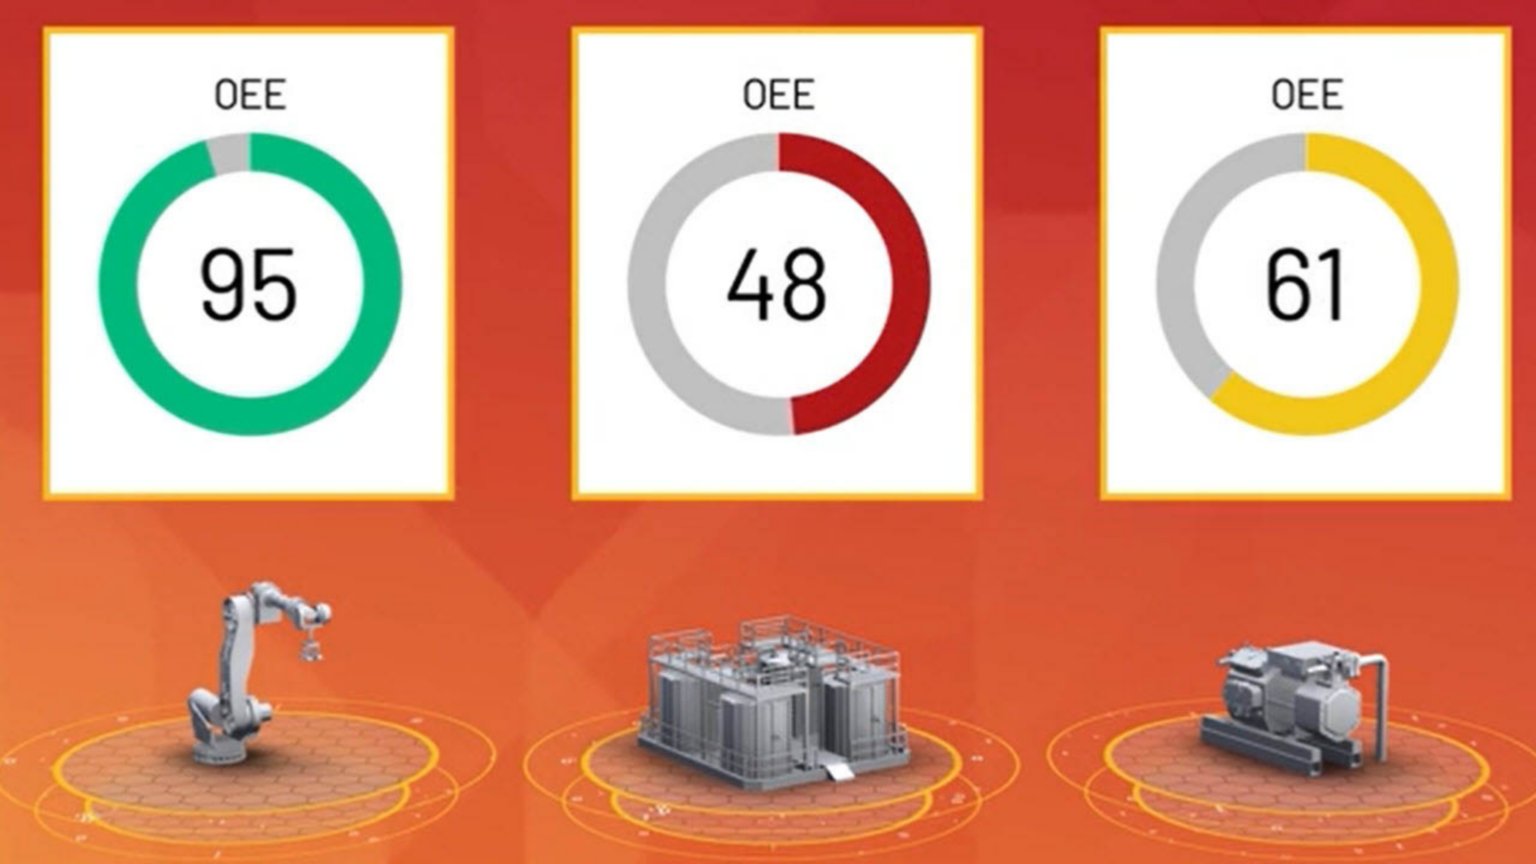
Predict Operational KPIs to Tighten Production
Forecast future KPI observations based on historical data using Predictive Fit Functions (forecasting, K–means, decision tree and more) for identifying new continuous improvement opportunities. Predictions can include a prediction interval which is a range that an observation will fall in. The prediction functions can be applied to any parts of the data set available to a storyboard.
What’s Your Learning Appetite?
Large, small, or in between, check out a wealth of resources to help you maximize your success.
Ready to Order Your Software?
Recommended for You